Exploring Deep Neural Networks and Transfer Learning for Analyzing Emotions in Tweets
An LSTM-CNN that slightly beats the SemEval-2018 benchmark on multi-label emotion classification (Jaccard 58.63 vs. 57.88). For intensity regression, features transferred from several pre-trained models into XGBoost reach 0.798 average Pearson, essentially tied with the top system (0.799) and best on fear and sadness. Deep SHAP heat-maps show which words and emoji drive each prediction.
Organizations want emotion and its intensity in public posts
Little labelled intensity data; opaque deep models
Problem
Emotion analysis usually stops at classification, but emotions vary in intensity. Labeled intensity data is scarce, and deep emotion models are rarely explained; attention weights give only a partial view.
Approach
- Data: SemEval-2018 Affect in Tweets. E-c has 11 emotions, multi-label, 10,983 tweets. EI-reg has per-emotion intensity for anger, fear, joy and sadness, about 3k tweets each (Table 1).
- ECCU (classification; Fig. 1): Twitter word2vec (frozen) → LSTM → CNN → max pooling → sigmoid. EIPU (intensity) uses the same design with a single output (Table 2).
- EITL (transfer learning for intensity; Fig. 2): concatenates features from ECCU, EIPU, DeepMoji and the OpenAI sentiment neuron, then trains an XGBoost regressor per emotion (Table 3).
- Explanations: Deep SHAP values normalized per tweet and rendered as word-level heat-maps (Eq. 2, Table 6).
- Preprocessing with ekphrasis (spell correction, segmentation).
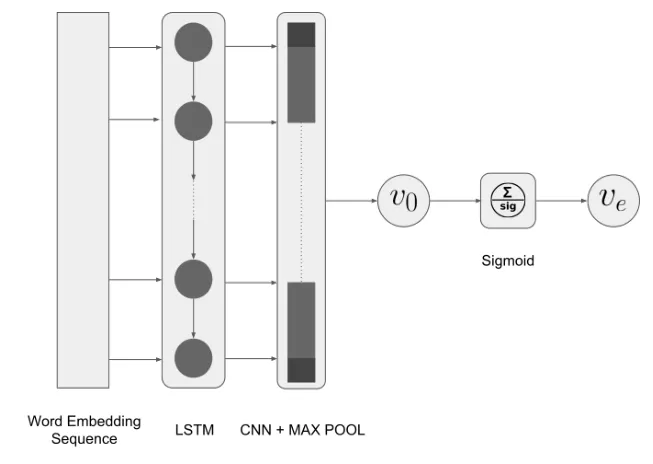 Fig. 1: Embeddings → LSTM → CNN with max pooling → sigmoid emotion vector.Figure from Senarath et al., arXiv 2020.
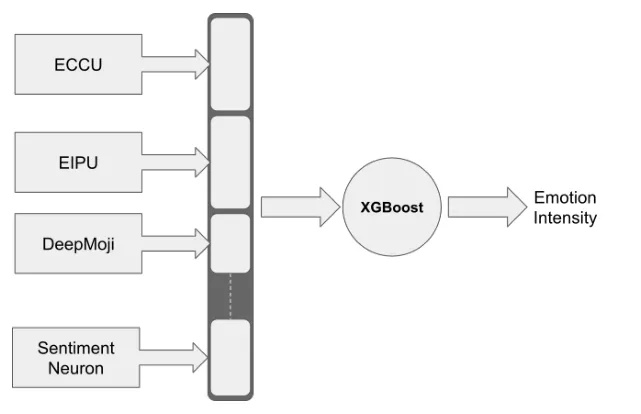 Fig. 2: ECCU, EIPU, DeepMoji and sentiment-neuron features → XGBoost → intensity.Figure from Senarath et al., arXiv 2020.
Key results
- Classification (Table 5): ECCU scores Jaccard 58.63, micro-F1 71.92, macro-F1 52.8, vs. NTUA-SLP 57.88 / 70.1 / 52.8, the benchmark the paper uses.
- Intensity (Table 4), Pearson r:
- EITL averages 79.81% vs. SeerNet 79.90% (state of the art) and NTUA-SLP 77.70%.
- Per emotion: fear 78.67 (vs. 77.90) and sadness 79.99 (vs. 79.80) beat SeerNet; anger is 82.16 vs. 82.70 and joy 78.42 vs. 79.20.
- EIPU alone reaches 70.83 avg, well above the BoW/NBoW baselines (52–64).
- Explanations (Table 6): keywords and emoji dominate the predictions, and the model takes context into account.
Contributions
- Simpler but effective models for emotion classification and intensity prediction.
- Applying state-of-the-art interpretation (Deep SHAP) to visualize and explain deep emotion-intensity models.
Future work
- Attention mechanisms (Transformers) to improve intensity prediction.
Cite this paper
Senarath, Y., Thayasivam, U. (2020). Exploring Deep Neural Networks and Transfer Learning for Analyzing Emotions in Tweets. Preprint.
@article{Senarath2020,
  author   = {Senarath, Yasas and Thayasivam, Uthayasanker},
  journal  = {Preprint},
  title    = {Exploring Deep Neural Networks and Transfer Learning for Analyzing Emotions in Tweets},
  year     = {2020},
  keywords = {arXiv,first}
}